Unlock the doors to the Indian stock market! Learn how to open demat account online & offline. This guide covers documents, charges & compares brokers. Start yo
Unlock the doors to the Indian stock market! Learn how to open demat account online & offline. This guide covers documents, charges & compares brokers. Start your investment journey today!
Your Step-by-Step Guide: Investing with a Demat Account
Understanding the Basics: What is a Demat Account?
In the dynamic world of Indian finance, a Demat account is your gateway to participating in the equity markets. It’s essentially a digital locker where your shares, bonds, and other financial instruments are held electronically. Think of it as a bank account for your investments. Before the advent of Demat accounts, physical share certificates were the norm, leading to cumbersome processes, delays, and risks of loss or damage. With the introduction of the Depositories Act in 1996, the electronic holding of securities became a reality, revolutionizing the Indian stock market. The two primary depositories in India are the National Securities Depository Limited (NSDL) and the Central Depository Services (India) Limited (CDSL).
Why Do You Need a Demat Account?
A Demat account is mandatory for trading in the Indian equity markets. SEBI, the Securities and Exchange Board of India, mandates this for all investors to ensure transparency, efficiency, and security in securities transactions. Here’s why it’s indispensable:
- Electronic Holding: Eliminates the risk of loss, theft, or damage associated with physical share certificates.
- Faster Transactions: Enables quicker trading and settlement of securities.
- Convenience: Makes buying and selling shares seamless through online platforms.
- Reduced Paperwork: Minimizes administrative hassles associated with physical certificates.
- Access to Multiple Investments: Allows you to hold a wide range of investments, including shares, bonds, mutual funds, and ETFs, in a single account.
Who Can Open a Demat Account?
Any resident Indian citizen, Non-Resident Indian (NRI), or Hindu Undivided Family (HUF) can open a Demat account, subject to certain eligibility criteria. Minors can also have Demat accounts, which are operated by their guardians until they reach adulthood.
Choosing the Right Depository Participant (DP)
While NSDL and CDSL are the depositories, you don’t directly open an account with them. Instead, you open it through a Depository Participant (DP). DPs are intermediaries registered with SEBI and connected to the depositories. They act as a link between you and the depository, providing Demat account services.
Choosing the right DP is crucial. Consider the following factors:
- Brokerage Charges: Compare account opening fees, annual maintenance charges (AMC), and transaction charges.
- Platform Usability: Opt for a DP with a user-friendly online trading platform and mobile app.
- Customer Service: Check for the quality of customer support and responsiveness.
- Range of Services: Some DPs offer additional services like research reports, investment advice, and portfolio management.
- Reputation and Reliability: Choose a well-established and reputable DP with a good track record.
Popular DPs in India include Zerodha, Upstox, Angel Broking, ICICI Direct, HDFC Securities, and SBI Securities. Research and compare them carefully before making a decision.
Documents Required for Opening a Demat Account
To open a Demat account, you’ll need to submit the following documents:
- Proof of Identity (POI): PAN card, Aadhaar card, passport, driving license, Voter ID card.
- Proof of Address (POA): Aadhaar card, passport, driving license, Voter ID card, utility bill (electricity, telephone, gas), bank statement.
- Proof of Income (POI): Income tax return (ITR) acknowledgement, salary slip, bank statement, Demat account statement. (This is often required only for trading in derivatives.)
- PAN Card: Mandatory for all Demat account holders.
- Passport-sized Photographs: Typically two passport-sized photographs.
Ensure that all documents are self-attested and contain the same name and address as mentioned in the application form.
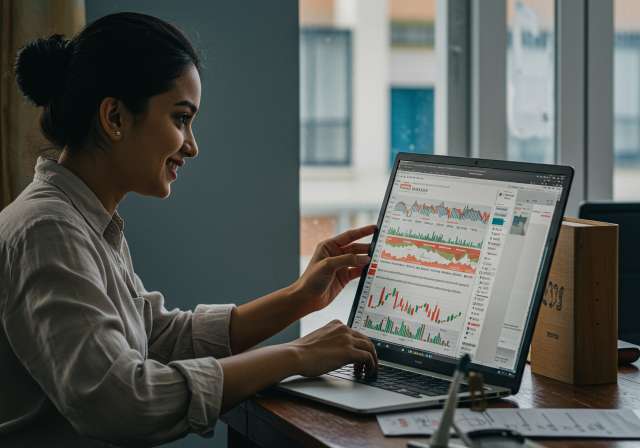
How to Open Demat Account: A Step-by-Step Guide
The process of opening a Demat account is relatively straightforward. You can do it either online or offline.
Online Demat Account Opening
- Choose a DP: Research and select a DP that suits your needs.
- Visit the DP’s Website: Go to the DP’s official website and look for the “Open Demat Account” or “Register” option.
- Fill in the Online Application Form: Provide your personal details, contact information, bank account details, and nominee details.
- Upload Documents: Scan and upload the required documents (POI, POA, PAN card, photograph).
- e-KYC Verification: Complete the e-KYC (Know Your Customer) process, which involves verifying your identity and address through Aadhaar-based authentication or video verification.
- In-Person Verification (IPV): Some DPs may require an IPV, either online or offline, to verify your details.
- Account Activation: Once your application is verified and approved, your Demat account will be activated. You will receive your account details (Client ID) via email or SMS.
Offline Demat Account Opening
- Choose a DP: Research and select a DP that suits your needs.
- Visit the DP’s Branch: Visit the nearest branch of your chosen DP.
- Obtain the Application Form: Collect the Demat account opening form from the branch.
- Fill in the Application Form: Provide your personal details, contact information, bank account details, and nominee details.
- Submit Documents: Submit the required documents (POI, POA, PAN card, photograph) along with the application form.
- In-Person Verification (IPV): The DP representative will conduct an IPV to verify your details.
- Account Activation: Once your application is verified and approved, your Demat account will be activated. You will receive your account details (Client ID) via mail.
Demat Account Charges: What to Expect
Opening and maintaining a Demat account involves certain charges. Understanding these charges is essential for managing your investment costs effectively:
- Account Opening Charges: Some DPs charge a one-time fee for opening a Demat account, while others offer free account opening.
- Annual Maintenance Charges (AMC): This is an annual fee charged by the DP for maintaining your Demat account. AMC can be a fixed amount or a percentage of the value of your holdings.
- Transaction Charges: These are charges levied on each buy or sell transaction. Transaction charges can be a percentage of the transaction value or a fixed amount per transaction.
- Custodian Charges: These charges are levied by the depository (NSDL or CDSL) for safeguarding your securities.
- Other Charges: Some DPs may charge for additional services like dematerialization (converting physical shares to electronic form), rematerialization (converting electronic shares to physical form), and account statements.
Compare the charges of different DPs carefully before opening your account.
Linking Your Bank Account to Your Demat Account
Linking your bank account to your Demat account is essential for seamless transactions. This allows you to transfer funds to your trading account for buying shares and receive proceeds from selling shares directly into your bank account. You’ll typically need to provide your bank account details (account number, IFSC code, bank name) during the Demat account opening process. The DP will then verify your bank account details.
Nominee Details: Protecting Your Investments
It’s crucial to nominate someone in your Demat account. A nominee is a person who will inherit your investments in the event of your death. This simplifies the transfer of securities to your legal heir and avoids legal complications. You can nominate one or more individuals as nominees. You’ll need to provide the nominee’s details (name, address, relationship) in the Demat account opening form.
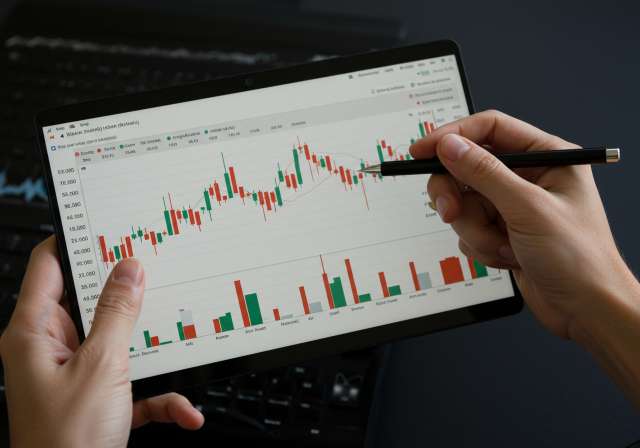
Using Your Demat Account for Investments
Once your Demat account is active, you can start investing in various financial instruments:
- Equity Shares: Buy and sell shares of companies listed on the NSE (National Stock Exchange) and BSE (Bombay Stock Exchange).
- Initial Public Offerings (IPOs): Apply for shares of companies that are going public.
- Mutual Funds: Invest in various mutual fund schemes, including equity funds, debt funds, and hybrid funds.
- Exchange-Traded Funds (ETFs): Invest in ETFs, which are baskets of securities that track a specific index or commodity.
- Bonds and Debentures: Invest in fixed-income securities issued by companies and government entities.
Before investing, conduct thorough research and understand the risks associated with each investment option. Consider consulting a financial advisor for personalized investment advice.
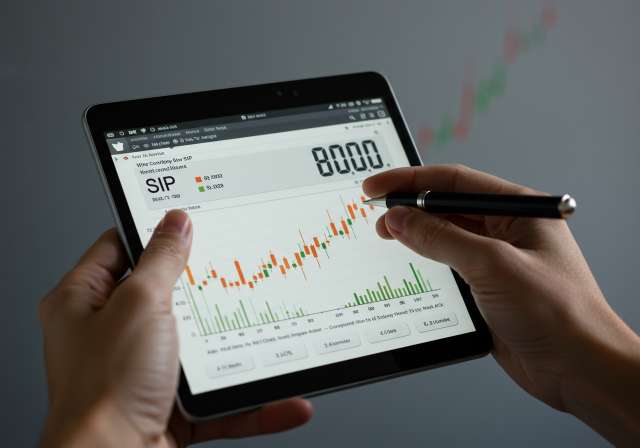
Investing Through SIPs and Other Options
Many investors in India prefer to invest through Systematic Investment Plans (SIPs) in mutual funds. SIPs allow you to invest a fixed amount regularly (e.g., monthly or quarterly), which helps in rupee cost averaging and disciplined investing. You can easily link your Demat account to your SIP investments. Besides SIPs, you can also consider investing in Equity Linked Savings Schemes (ELSS) for tax benefits under Section 80C of the Income Tax Act, Public Provident Fund (PPF), and National Pension System (NPS) for long-term retirement planning. All these investments can be managed efficiently through a well-maintained Demat account.
Conclusion: Embark on Your Investment Journey Today!
Opening a Demat account is the first step towards building a secure financial future in the Indian market. With the convenience of online trading and the security of electronic holding of securities, investing in the stock market has become more accessible than ever. Choose the right DP, gather the necessary documents, and follow the steps outlined in this guide to open your Demat account today. Remember to invest wisely, diversify your portfolio, and stay informed about market trends. Happy investing!